Coordinator of Multi-Tiered System of Supports
Office of Academic Services
507.328.4490 | Email
In MTSS, data is more than numbers on a page—it is the foundation for solving problems and making informed decisions that directly impact students’ academic growth, behavior, and social-emotional well-being. When used effectively, data creates a continuous cycle of improvement, helping schools strengthen educator support, refine policies, and enhance instructional practices.
Data sources might include existing academic and demographic records, surveys, interviews, observations, program / policy / process data, fidelity data, and student mastery data. By weaving these data sources together, educators gain a clearer picture of both student needs and system effectiveness. This ensures that decisions are not only evidence-based, but also equitable, timely, and responsive to the realities of the classroom.
Coordinator of Multi-Tiered System of Supports
Office of Academic Services
507.328.4490 | Email
Rochester Public Schools uses eduCLIMBER, an integrated data system that helps teams collect, access, and analyze educational data in one place. The system supports a whole-child view by combining academic, behavioral, and social-emotional information, allowing educators to track student progress across grades, subjects, and tiers of support. eduCLIMBER also makes it easier to examine data for different student groups, monitor trends over time, and ensure equitable outcomes. By providing a clearer picture of student learning and well-being, the system helps teams make more informed decisions.
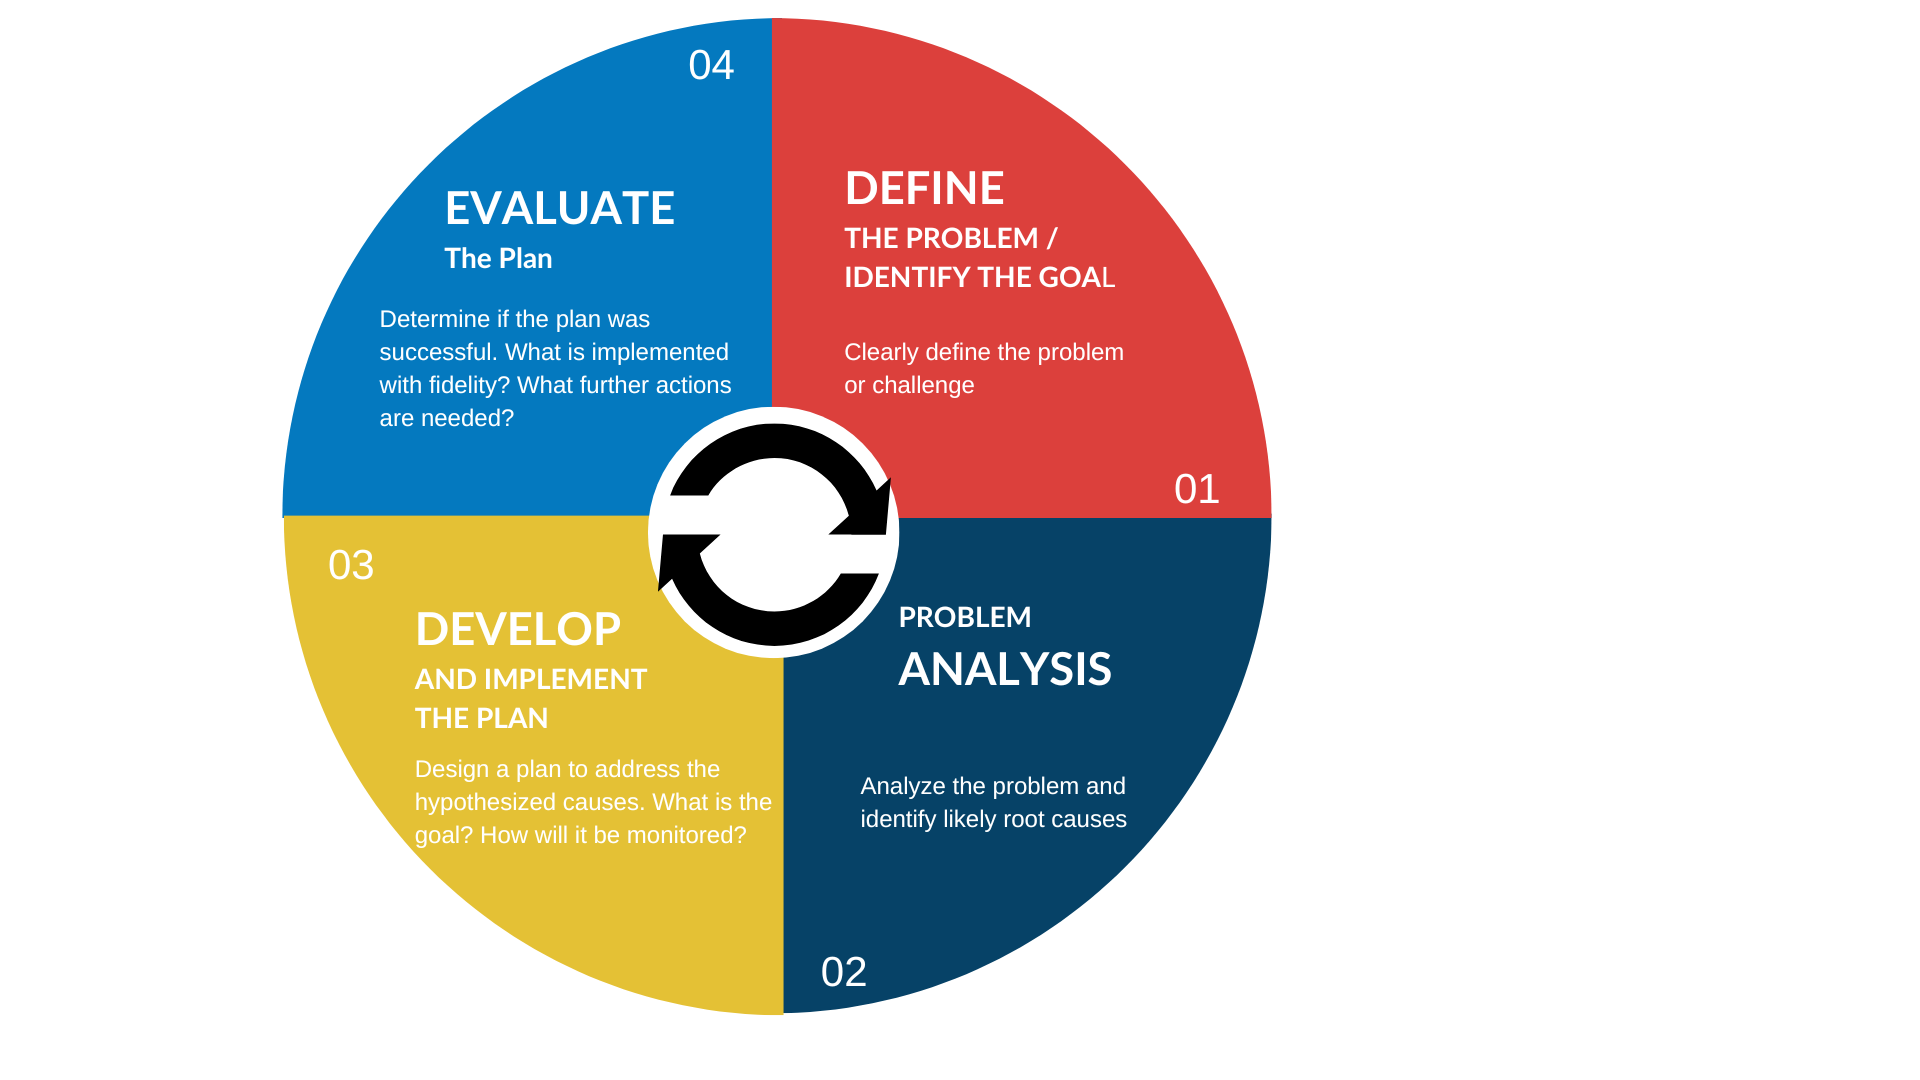
Rochester Public Schools uses a structured 4-Step Problem Solving Process to guide decision making and improve student outcomes. This process provides a clear framework for teams to identify student needs, plan supports, and evaluate the effectiveness of their actions.
The steps are cyclical, meaning that data are collected, plans are monitored, and strategies are continually refined and evaluated. By following this process, schools engage in ongoing reflection and action, ensuring that improvement is not a one-time event but a sustained effort that adapts to the evolving needs of students.
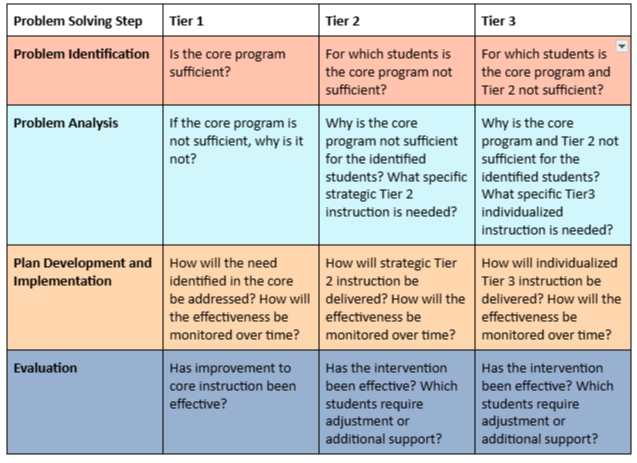
The 4-Step Problem Solving Process can be applied at all tiers of instruction to guide data-driven decision making. By using this structured approach, teams ensure that supports are targeted, evidence-based, and responsive to student needs at every level of instruction.
Sites conduct data review cycles at least three times per year, following the protocols outlined in the MTSS Data Meetings Guides. During these cycles, teams analyze student data, identify gaps, and make decisions to strengthen interventions and instruction. Explore the MTSS Data Meetings folders for more tools to support building level teams.
Across all tiers of instruction, data are used to identify gaps between expected and current student outcomes in academics, behavior, and social-emotional growth. When determining a student’s responsiveness to instruction, teams consider both performance level and rate of growth. Using these two indicators together provides a fuller understanding of student progress. Performance level reflects a student’s achievement at a single point in time (for example, universal screening or benchmark cut-offs), while rate of growth shows progress over time (such as average weekly improvement). By examining both grade-level expectations and growth, teams gain a comprehensive picture of whether students are responding to instruction and whether the gains are educationally meaningful.
All decisions regarding student responsiveness should be documented in eduCLIMBER to ensure clear communication and continuity of support
When reviewing progress over time, there are various ways that teams can analyze progress monitoring graphs:
Consecutive Data Rule
Trend Line Rule
Median of Last Three Data Rule
Consecutive Data Rule | Trendline Analysis | Median of Last 3 Data Rule | |
How many weeks of data are needed? | 3 | 4 | 4 |
How many data points are needed (if more frequent than weekly) | 6 | 8 | 8 |
Recommended Use | When there are limited outliers & you don’t have a system that calculates a trend line. | When you have a system that will calculate a trendline for you. | When you need quick data analysis that limits the influence of outliers. |
Advantages | Simple & quick, easiest method to visually analyze | Highly accurate, easy to interpret when you have enough data | Quick to analyze, reduces outlier impact, allows for timely instructional adjustments |
Considerations | May be less accurate as it relies on consecutive data points; outliers in the last 4 points can impact interpretation | Requires enough data for reliability and can be influenced by outliers. Involves calculations or a system that calculates | May miss trends if data varies widely, becomes more accurate with more data, must have at least 4 weeks or 8 total data points |
When reviewing intervention data, it is important to consider not only what students are learning but also how the intervention is being implemented. One reason a student may show slow or limited progress is that the intervention is not being delivered with full fidelity. Fidelity data allow teams to determine whether lack of responsiveness is due to the student’s needs or to gaps in implementation. By monitoring the key elements, educators can rule out issues such as insufficient time, skipped components, or low engagement as reasons for lack of progress. This ensures that any decision to adjust, intensify, or change an intervention is based on accurate data—both about student performance and the integrity of the instruction provided.
The key components of fidelity include:
Adherence: The extent to which an intervention is delivered according to the prescribed procedures or components. It answers the question: Are we following the program as designed?
Exposure / Duration: The amount of the intervention that students actually receive, including the frequency, length, and total time. This ensures students have sufficient opportunity to benefit from the instruction. It answers the question: Are students receiving the right amount of instructional time, in terms of frequency, length, and total sessions?
Quality of Delivery: How well the intervention is implemented, including the instructor’s skill, clarity, and effectiveness in delivering the content. High-quality delivery increases the likelihood of positive student outcomes. It answers the question: Is the instruction delivered clearly, effectively, and in an engaging manner?
Program Specificity: The degree to which the intervention targets specific skills, behaviors, or objectives as outlined in the program design. This ensures that instruction is focused and purposeful. It answers: Does the intervention directly target the skills or behaviors it was designed to address?
Student Engagement: The level of active participation and involvement by students during the intervention. Engaged students are more likely to learn and retain the targeted skills. It answers the question: Are students actively participating and invested during the intervention?
According to Fuchs et al. (2017), utilizing student data to determine if an intervention needs intensification involves a structured approach that aligns with the Taxonomy of Intervention Intensity. This taxonomy outlines seven dimensions—strength, dosage, alignment, attention to transfer, comprehensiveness, behavioral support, and individualization—that can be adjusted to enhance intervention effectiveness